Using insights from Ride with GPS, we get a fascinating look at how far cyclists ride across age groups.
Whether you’re in your 20s or well into your 80s, there’s something here to learn – and maybe even get inspired by.
Comfort matters more than you think
According to cycling expert Kristen Phillips, comfort is key to staying in the saddle longer.
If your hands, saddle, or feet feel off, your ride might be cut short – no matter your fitness level.
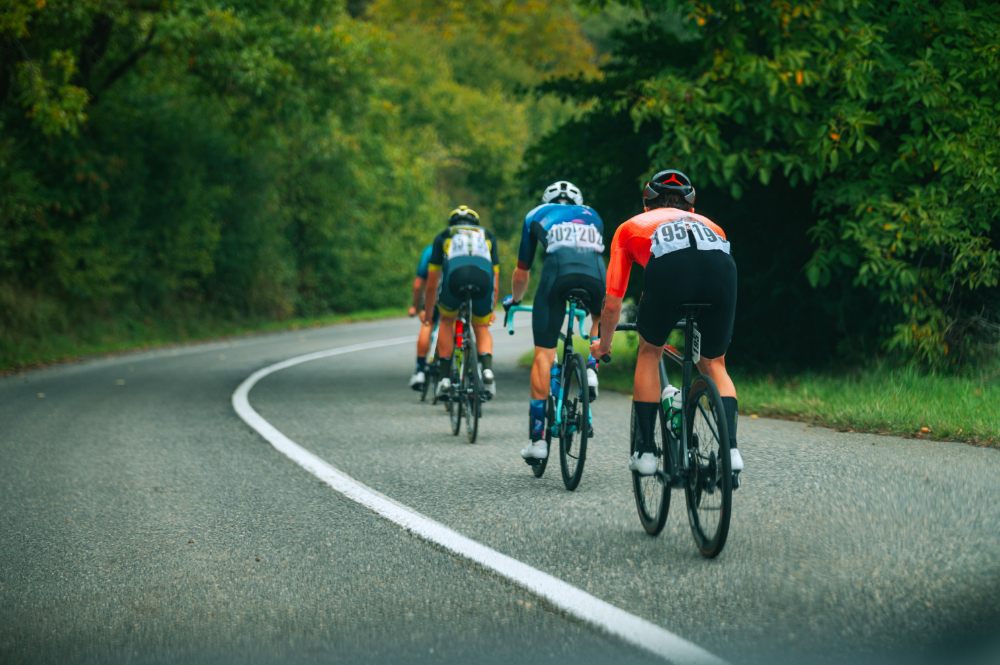
Speed changes with terrain

Data from Strava in 2023 shows a major difference in average cycling speed depending on the surface.
On asphalt, the average is 22.7 km/h, but on gravel, it drops to just 13.8 km/h. So, where you ride really affects how far you can go.
20-30

Riders aged 20–30 clock in an average of 16.6 miles (around 26.7 km) per ride.
It’s a strong start for the youngest adult group, though older cyclists actually go even further.
30-40
Cyclists in their 30s push the average up to 18.1 miles, or about 29.1 km.
It reflects a phase of life where many prioritize fitness and structure their time to include more regular training.
40-50
In the 40–50 age group, people average 18.5 miles per ride – nearly 30 km.
Experience and consistency likely play a role, as these riders tend to be more seasoned.
50-60

Bikers aged 50–60 aren’t slowing down. They reach an average of 19.7 miles (31.7 km), signaling both dedication and physical resilience that often improves with time in the sport.
60-70

This age group sees a noticeable leap in distance, averaging 22 miles per ride – that’s 35.4 km.
More time, fewer work obligations, and long-term cycling habits might explain the jump.
70-80

The 70–80 age group tops the chart at 22.3 miles or 35.9 km per ride.
It challenges assumptions about aging, showing that endurance and love for cycling can peak later in life.
80-90

Even in their 80s, many cyclists are averaging 19.2 miles – roughly 30.9 km.
It’s only a small dip from younger decades and highlights how cycling can be a lifelong pursuit.
The average distance

Across all age groups on Ride with GPS, the average trip distance stands at 18 miles or 29 km. It’s a solid benchmark if you’re wondering where you fall in the mix.
This article is based on information from Bicycling.com.